Figure 1. 
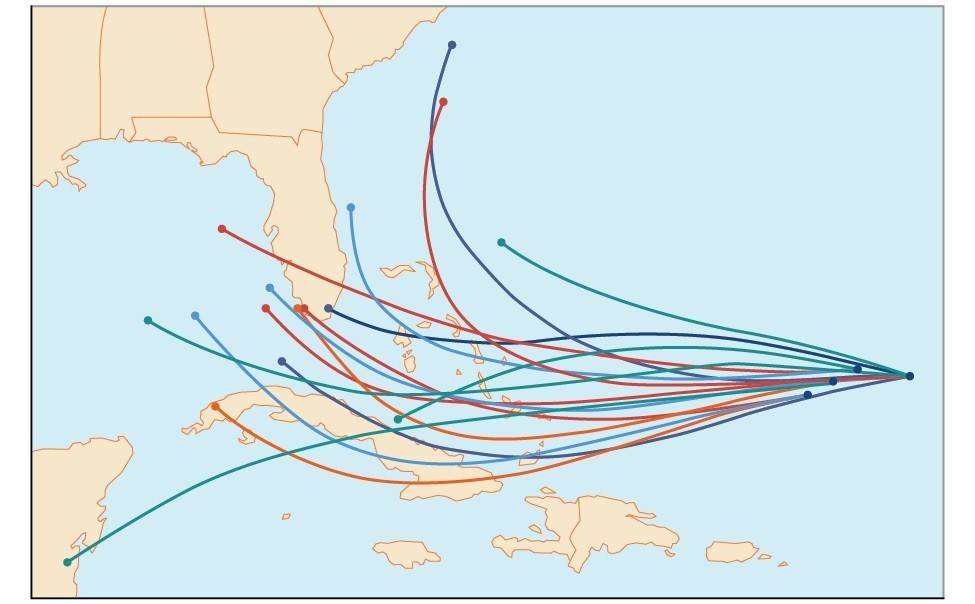
An example of a "spaghetti model," which can be used to predict possible paths of a tropical storm.
Residents of the Southeastern United States are all too familiar with charts, known as spaghetti models, such as the one in Figure 1.[footnote]The figure is for illustrative purposes only and does not model any particular storm.[/footnote] They combine a collection of weather data to predict the most likely path of a hurricane. Each colored line represents one possible path. The group of squiggly lines can begin to resemble strands of spaghetti, hence the name. In this section, we will investigate methods for making these types of predictions.