Define Domain and Range from a Graph
Learning Objectives
- Find domain and range from a graph, and an equation
- Define the domain and range of the toolkit functions
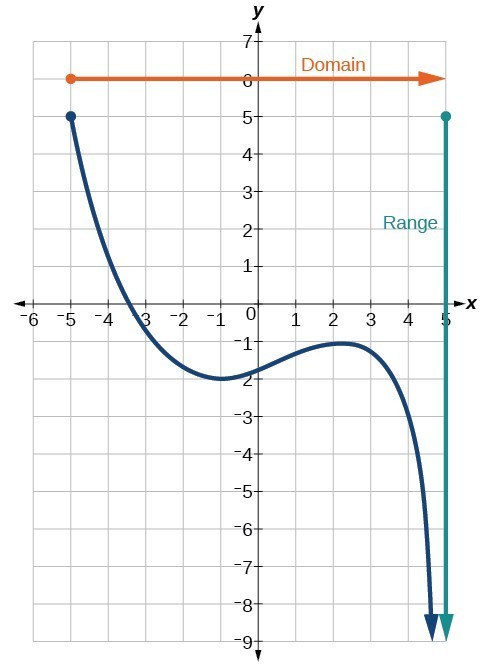 We can observe that the graph extends horizontally from to the right without bound, so the domain is . The vertical extent of the graph is all range values and below, so the range is . Note that the domain and range are always written from smaller to larger values, or from left to right for domain, and from the bottom of the graph to the top of the graph for range.
Example: Finding Domain and Range from a Graph
Find the domain and range of the function .![Graph of a function from (-3, 1].](https://s3-us-west-2.amazonaws.com/courses-images/wp-content/uploads/sites/896/2016/10/18193551/CNX_Precalc_Figure_01_02_0072.jpg)
Answer:
We can observe that the horizontal extent of the graph is –3 to 1, so the domain of is .
 The vertical extent of the graph is 0 to , so the range is .
Example: Finding Domain and Range from a Graph of Oil Production
Find the domain and range of the function .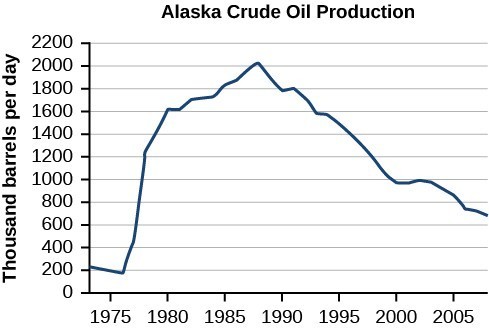 (credit: modification of work by the U.S. Energy Information Administration)
Answer: The input quantity along the horizontal axis is "years," which we represent with the variable for time. The output quantity is "thousands of barrels of oil per day," which we represent with the variable for barrels. The graph may continue to the left and right beyond what is viewed, but based on the portion of the graph that is visible, we can determine the domain as and the range as approximately . In interval notation, the domain is [1973, 2008], and the range is about [180, 2010]. For the domain and the range, we approximate the smallest and largest values since they do not fall exactly on the grid lines.
Try It
Given the graph, identify the domain and range using interval notation.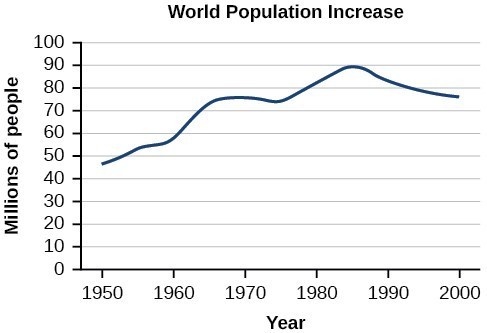
Answer: Domain = [1950, 2002] Range = [47,000,000, 89,000,000]
Q & A
Can a function’s domain and range be the same? Yes. For example, the domain and range of the cube root function are both the set of all real numbers.Domain and Range of Toolkit Functions
We will now return to our set of toolkit functions to determine the domain and range of each.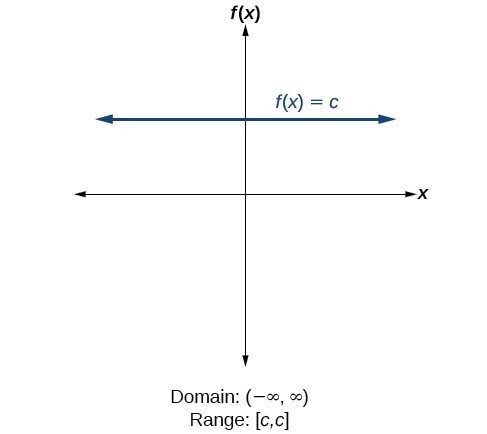 For the constant function , the domain consists of all real numbers; there are no restrictions on the input. The only output value is the constant , so the range is the set that contains this single element. In interval notation, this is written as , the interval that both begins and ends with .
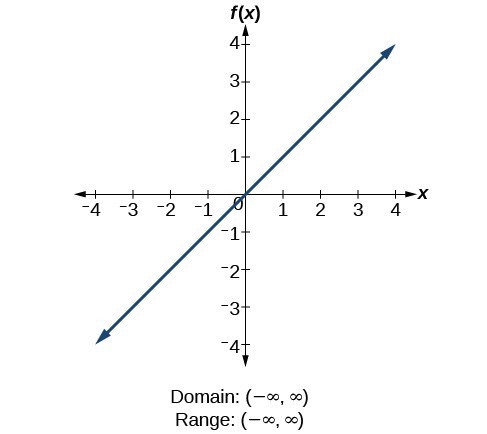 For the identity function , there is no restriction on . Both the domain and range are the set of all real numbers.
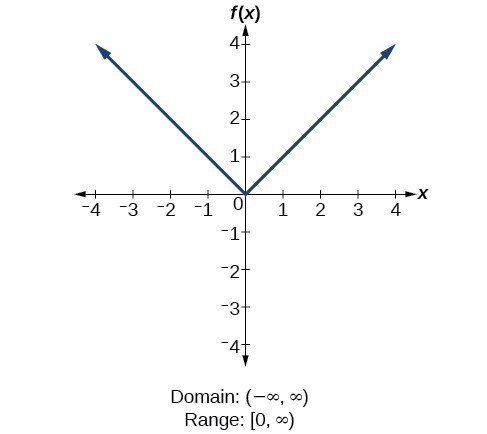 For the absolute value function , there is no restriction on . However, because absolute value is defined as a distance from 0, the output can only be greater than or equal to 0.
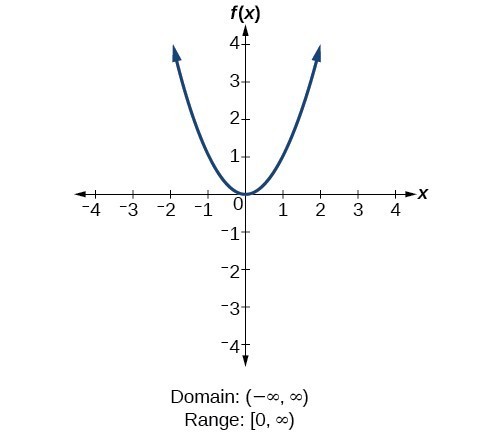 For the quadratic function , the domain is all real numbers since the horizontal extent of the graph is the whole real number line. Because the graph does not include any negative values for the range, the range is only nonnegative real numbers.
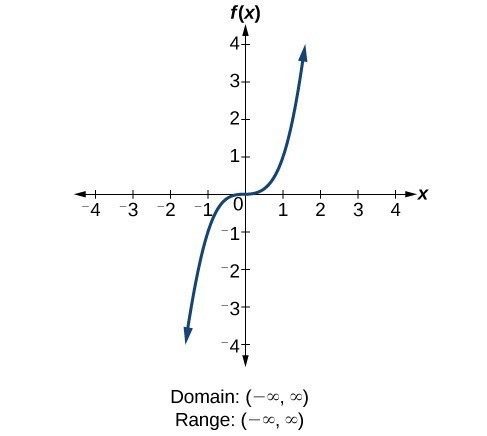 For the cubic function , the domain is all real numbers because the horizontal extent of the graph is the whole real number line. The same applies to the vertical extent of the graph, so the domain and range include all real numbers.
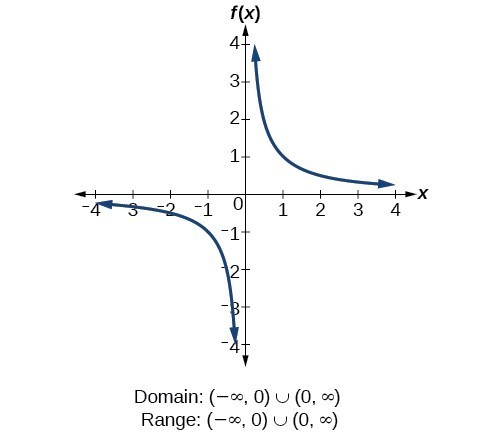 For the reciprocal function , we cannot divide by 0, so we must exclude 0 from the domain. Further, 1 divided by any value can never be 0, so the range also will not include 0. In set-builder notation, we could also write , the set of all real numbers that are not zero.
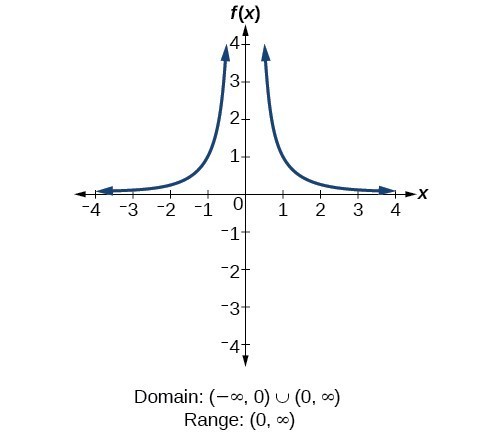 For the reciprocal squared function , we cannot divide by , so we must exclude from the domain. There is also no that can give an output of 0, so 0 is excluded from the range as well. Note that the output of this function is always positive due to the square in the denominator, so the range includes only positive numbers.
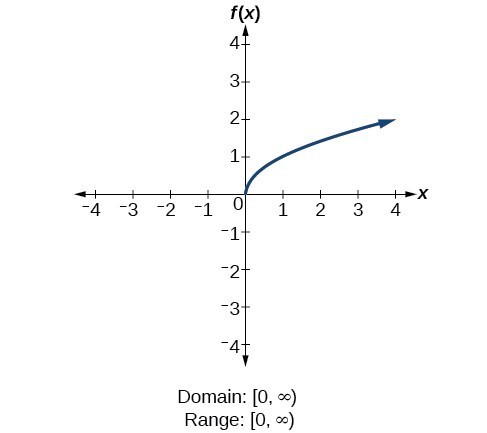 For the square root function , we cannot take the square root of a negative real number, so the domain must be 0 or greater. The range also excludes negative numbers because the square root of a positive number is defined to be positive, even though the square of the negative number also gives us .
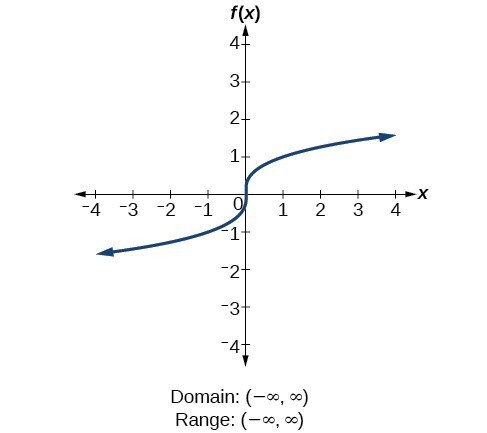 For the cube root function , the domain and range include all real numbers. Note that there is no problem taking a cube root, or any odd-integer root, of a negative number, and the resulting output is negative (it is an odd function).