Horizontal and Vertical Shifts of Logarithmic Functions
Learning Objectives
- Graph horizontal and vertical shifts of logarithmic functions
Graphing a Horizontal Shift of
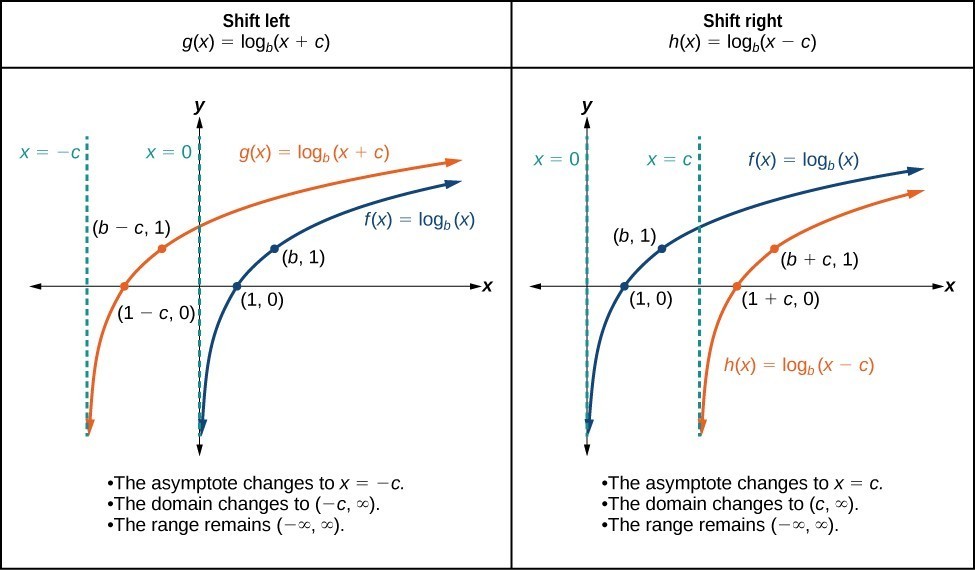
When a constant c is added to the input of the parent function , the result is a horizontal shift c units in the opposite direction of the sign on c. To visualize horizontal shifts, we can observe the general graph of the parent function and for c > 0 alongside the shift left, , and the shift right, .Try it
In the graphs below, you can use the slider for the variable c to investigate horizontal shifts that are produced by either adding or subtracting a constant from the input of a logarithmic function. The function represents adding c units to the input of the function, and the function represents subtracting c units from the input of the function. Investigate the following questions:- Adjust the slider for c to 4.
- Which direction does the graph of shift? What is the vertical asymptote, x-intercept, and equation for this new function? How do the domain and range change?
- Which direction does the graph of shift? What is the vertical asymptote, x-intercept, and equation for this new function? How do the domain and range change?
A General Note: Horizontal Shifts of the Parent Function
For any constant c, the function- shifts the parent function left c units if c > 0.
- shifts the parent function right c units if c < 0.
- has the vertical asymptote x = –c.
- has domain .
- has range .
How To: Given a logarithmic function with the form , graph the translation.
- Identify the horizontal shift:
- If c > 0, shift the graph of left c units.
- If c < 0, shift the graph of right c units.
- Draw the vertical asymptote x = –c.
- Identify three key points from the parent function. Find new coordinates for the shifted functions by subtracting c from the x coordinate.
- Label the three points.
- The Domain is , the range is , and the vertical asymptote is x = –c.
Example: Graphing a Horizontal Shift of the Parent Function
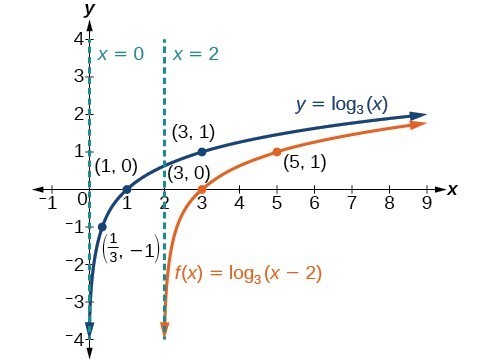
Sketch the horizontal shift alongside its parent function. Include the key points and asymptotes on the graph. State the domain, range, and asymptote.Answer:
Since the function is , we notice .
Thus c = –2, so c < 0. This means we will shift the function right 2 units.
The vertical asymptote is or x = 2.
Consider the three key points from the parent function, , , and .
The new coordinates are found by adding 2 to the x coordinates.
Label the points , , and .
The domain is , the range is , and the vertical asymptote is x = 2.
Try It
Sketch a graph of alongside its parent function. Include the key points and asymptotes on the graph. State the domain, range, and asymptote.Answer:
The domain is , the range , and the asymptote x = –4.

Graphing a Vertical Shift of
When a constant d is added to the parent function , the result is a vertical shift d units in the direction of the sign on d. To visualize vertical shifts, we can observe the general graph of the parent function alongside the shift up, and the shift down, .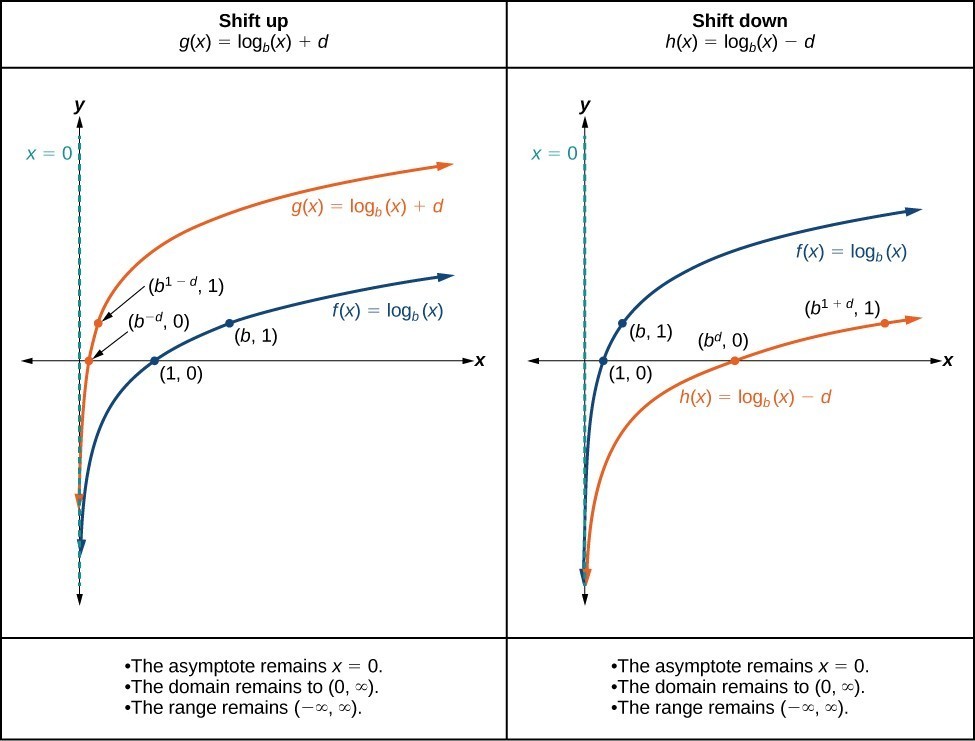
A General Note: Vertical Shifts of the Parent Function
For any constant d, the function- shifts the parent function up d units if d > 0.
- shifts the parent function down d units if d < 0.
- has the vertical asymptote x = 0.
- has domain .
- has range .
How To: Given a logarithmic function with the form , graph the translation.
- Identify the vertical shift:
- If d > 0, shift the graph of up d units.
- If d < 0, shift the graph of down d units.
- Draw the vertical asymptote x = 0.
- Identify three key points from the parent function. Find new coordinates for the shifted functions by adding d to the y coordinate.
- Label the three points.
- The domain is , the range is , and the vertical asymptote is x = 0.
Example: Graphing a Vertical Shift of the Parent Function
Sketch a graph of alongside its parent function. Include the key points and asymptote on the graph. State the domain, range, and asymptote.Answer: Since the function is , we will notice d = –2. Thus d < 0. This means we will shift the function down 2 units. The vertical asymptote is x = 0. Consider the three key points from the parent function, , , and . The new coordinates are found by subtracting 2 from the y coordinates. Label the points , , and .
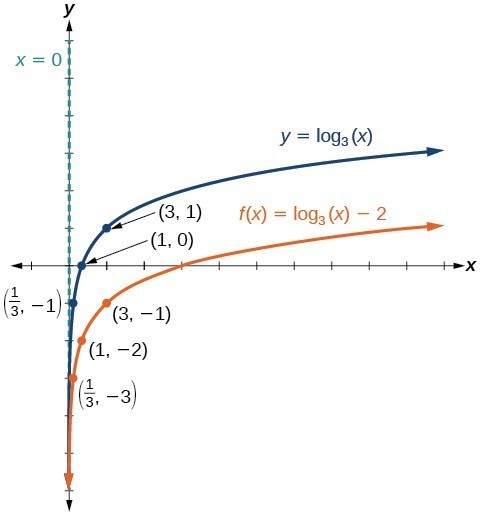 The domain is , the range is , and the vertical asymptote is x = 0.
Try It
Sketch a graph of alongside its parent function. Include the key points and asymptote on the graph. State the domain, range, and asymptote.Answer: The domain is , the range is , and the vertical asymptote is x = 0.

